The following results go beyond individual food items. They reveal structure, repetition, diversity, and relationships within a year of real-world plant consumption.
Rather than evaluating foods as “healthy” or “unhealthy”, Nutritio Botanica looks at diet as a botanical system: which species appear, how often, in which combinations, and across which seasons.
The analyses below combine classical descriptive statistics with ecological diversity measures and visual explorations. Each view highlights a different aspect of the same dataset — together, they form a coherent picture of how plant diversity actually manifests in everyday eating.
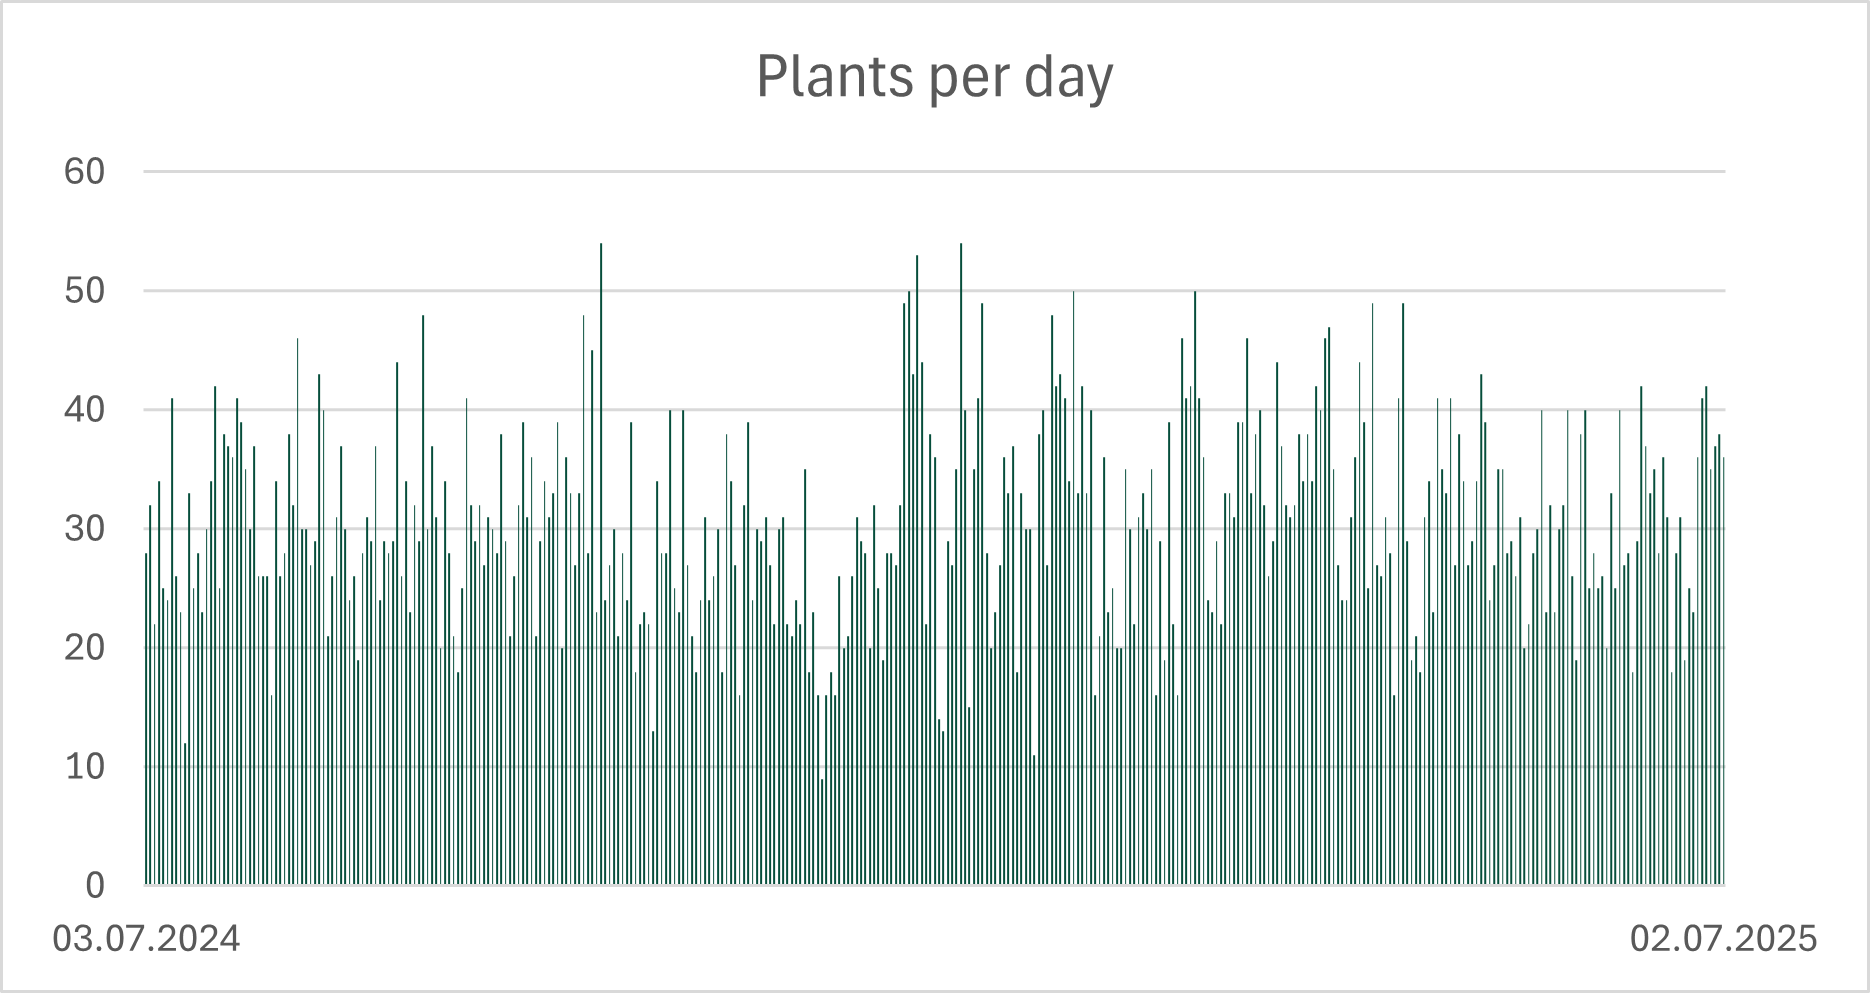
The dataset captures plant consumption at a very fine temporal resolution: every single day over the course of one year. In total, 222 different plants were recorded, corresponding to 206 botanical species.
What immediately stands out is the level of daily variety. On average, 30.5 different plants appear in the diet each day. However, this diversity is not static. The daily count fluctuates substantially over the year, reflecting changing meals and habits, but - apparently - not seasonal availability.
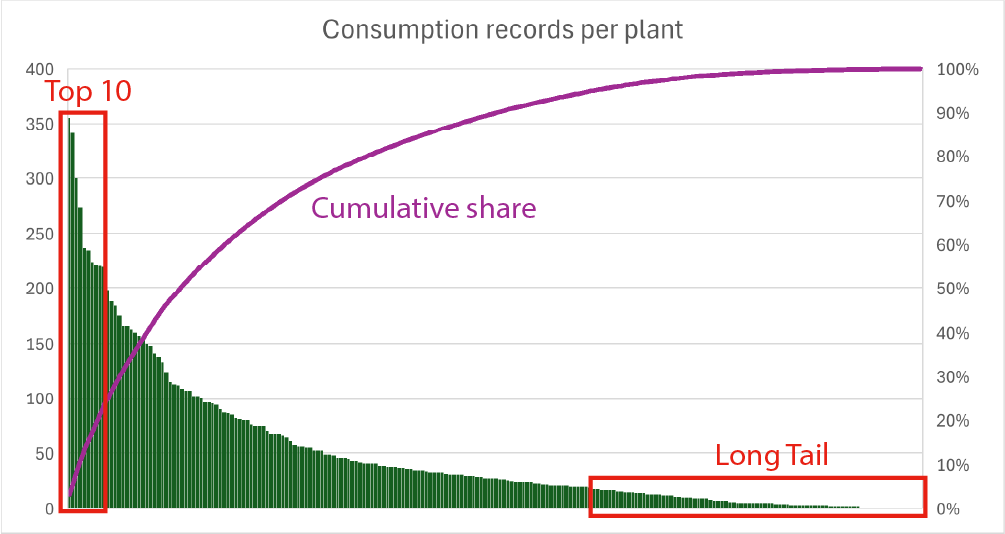
High diversity does not imply evenness. Although a wide range of plant species appears in the diet, overall consumption is shaped by a relatively small core group. The ten most frequently used plants alone account for 23.6 % of all consumption records.
These dominant species are: wheat, tea, sugar beet, coffee, tomato, sunflower, oat, onion, pepper, and cocoa. They form the botanical backbone of everyday eating, recurring across meals, seasons, and food categories.
In contrast, the remaining 196 species occupy a long tail of rare or occasional use. Some appear only sporadically, often tied to specific dishes or seasons. Sixteen plants were consumed only once during the entire year, highlighting how botanical diversity is unevenly distributed in practice.
Together, these perspectives reveal a characteristic structural pattern: high daily variety combined with strong concentration. Many plants are present, but only a few appear again and again. This tension between diversity and dominance forms the analytical backdrop for all subsequent explorations of the data.
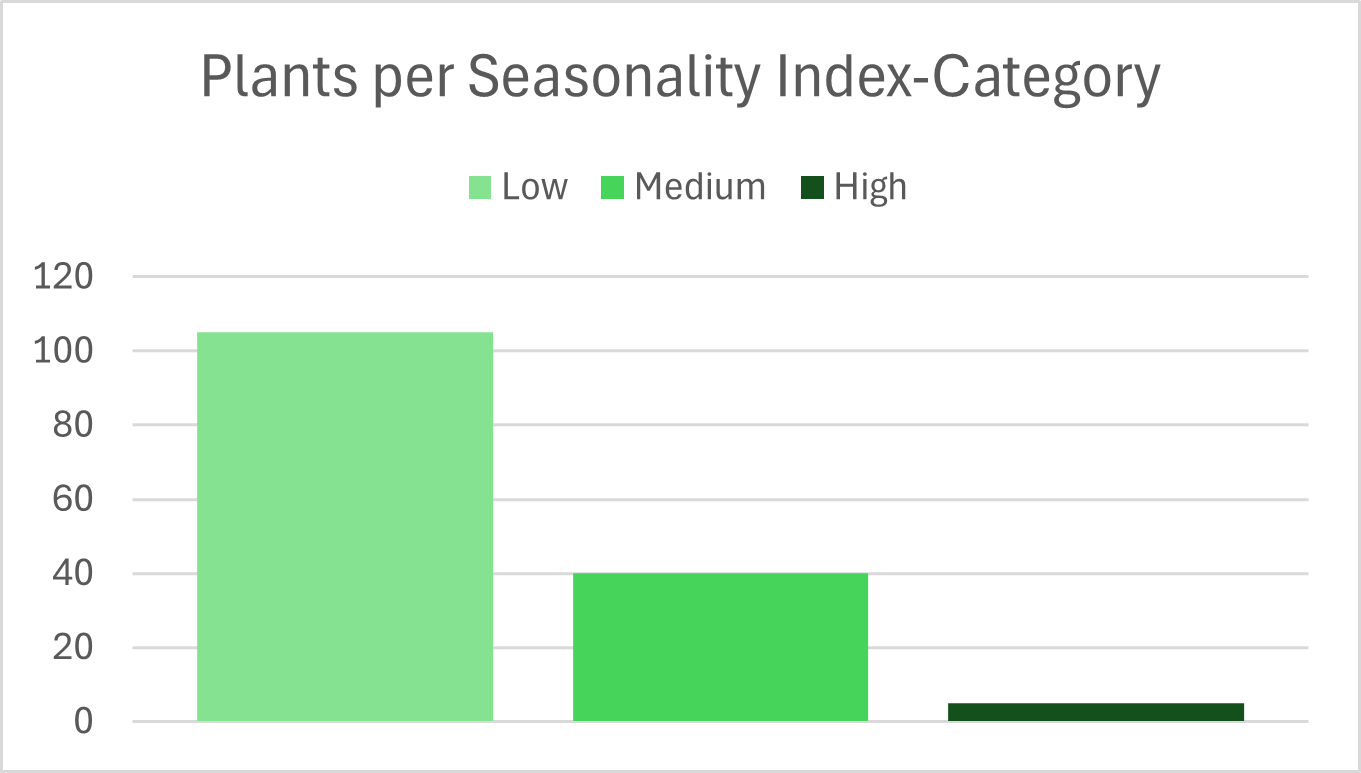
Plant consumption is often assumed to be strongly seasonal. To test this assumption, Nutritio Botanica examines how evenly individual plants are used across the year. For each species consumed at least ten times, monthly consumption counts were used to calculate a seasonal variability index, capturing deviations from a uniform distribution.
The results reveal a surprisingly stable pattern. Most plants (105 species) show low seasonal variability, indicating that they are consumed relatively evenly throughout the year. Forty species exhibit moderate seasonality, while only five plants show pronounced seasonal patterns.
These highly seasonal plants are Thymus serpyllum, Chondrus crispus, Rosa canina, Echinacea purpurea, and Diospyros kaki. Their seasonality is not driven by fresh produce availability, but by specific usage contexts. Three of them — Thymus serpyllum, Chondrus crispus, and Echinacea purpurea — were mainly consumed as ingredients in herbal throat lozenges. Rosa canina appeared primarily as an herbal tea, while Diospyros kaki was consumed as a seasonal fruit.
Notably, all five species reached their peak consumption in autumn or winter, reflecting their association with cold seasons, respiratory remedies, or seasonal availability rather than everyday meals.
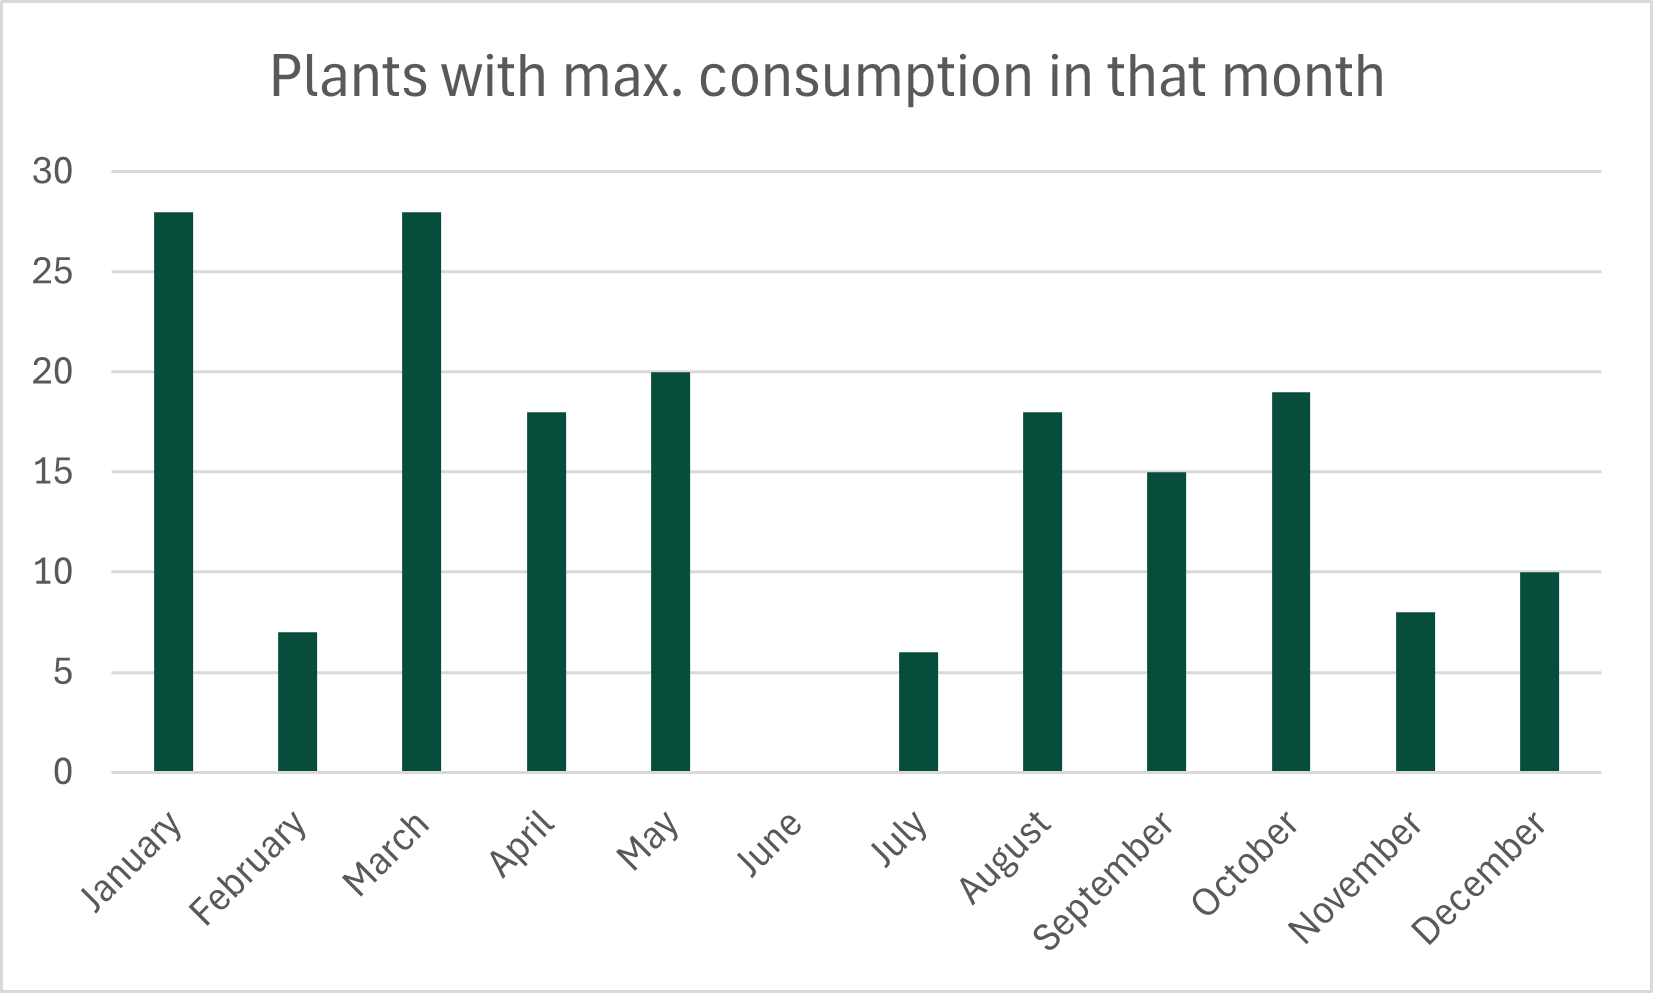
Looking more broadly at the timing of peak consumption across all species adds a temporal perspective. Peaks are distributed across the year, with higher concentrations in January and March (28 species each), and none in June. The total count exceeds the number of species analysed, as some plants reached identical maximum values in more than one month and were therefore counted multiple times.
Taken together, these findings reflect a fundamental shift in how plant foods enter everyday diets. Many fruits, vegetables, and other crop plants that were once tightly bound to specific seasons are now available almost year-round. Even when fresh produce is not locally in season, preservation methods such as drying, freezing, or freeze-drying make many plants accessible throughout the year. As a result, seasonality no longer structures the overall diet as strongly as it once did, but remains visible in a small number of plants whose use is still tied to particular times of the year.
Counting plant species shows how many types appear in the diet, but not their usage. A dataset may list hundreds of species yet be dominated by a few staples. To capture both variety and usage, two complementary diversity indices were applied: Shannon and Simpson.
The Shannon index (H')measures how unpredictable a randomly selected consumption record is. It increases when more species are present and when they are distributed more evenly. Therefore, two datasets with the same number of species can differ substantially in their Shannon index.
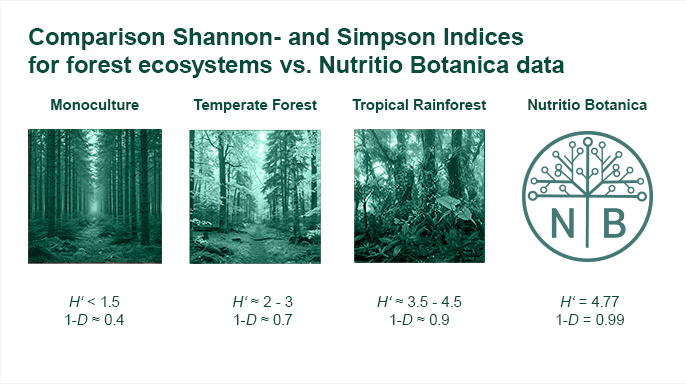
In this dataset, the Shannon index is 4.77. With 200 recorded plant species, the theoretical maximum Shannon value is
ln(200) ≈ 5.30
This means that the observed value reaches approximately 90 % of the theoretical maximum, indicating a very high level of diversity combined with substantial evenness.
By way of comparison, the Shannon index reported for highly diverse natural systems, such as tropical forest plots or coral reef fish communities, is typically in the range of 4.0 to 4.5. Agricultural systems, on the other hand, tend to be much lower. Against this backdrop, the dietary dataset exhibits a remarkably high level of diversity.
While the Shannon index is sensitive to rare species, the Simpson index (1-D) emphasizes dominance. It represents the probability that two randomly selected consumption records belong to different species. Values close to 1 indicate that no single species strongly dominates the dataset.
The Simpson index of 0.99 confirms that even the most frequently consumed plants account for only a small fraction of total consumption records. Dominance exists, but it is weak.
Together, the two indices describe a system with very high diversity and limited dominance. Many species contribute meaningfully to the overall pattern, while a smaller group of frequently consumed plants provides structural stability. This balance between breadth and concentration forms the foundation for the subsequent analyses of rank, dominance, and associations.
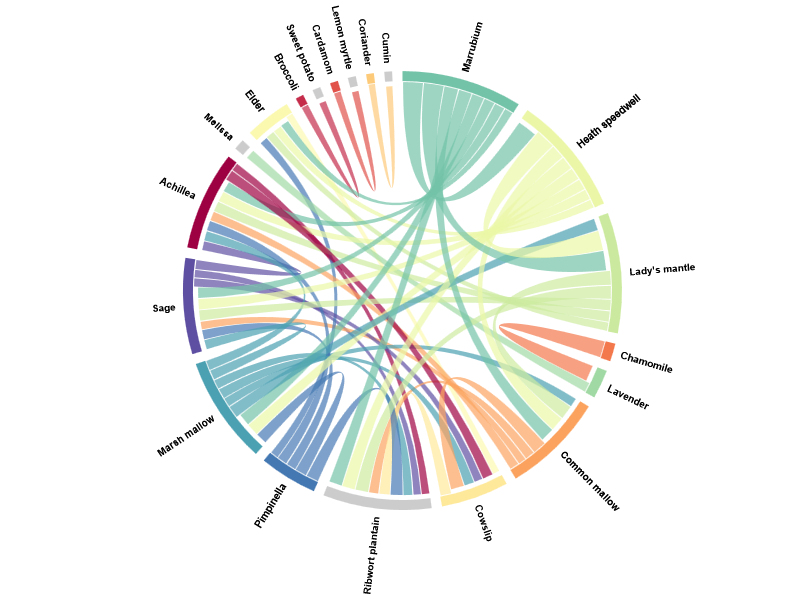
Figure 6: Chord diagram of plant pairs with medium and high lift values, highlighting a distinct cluster of medicinal plants with recurring co-use.
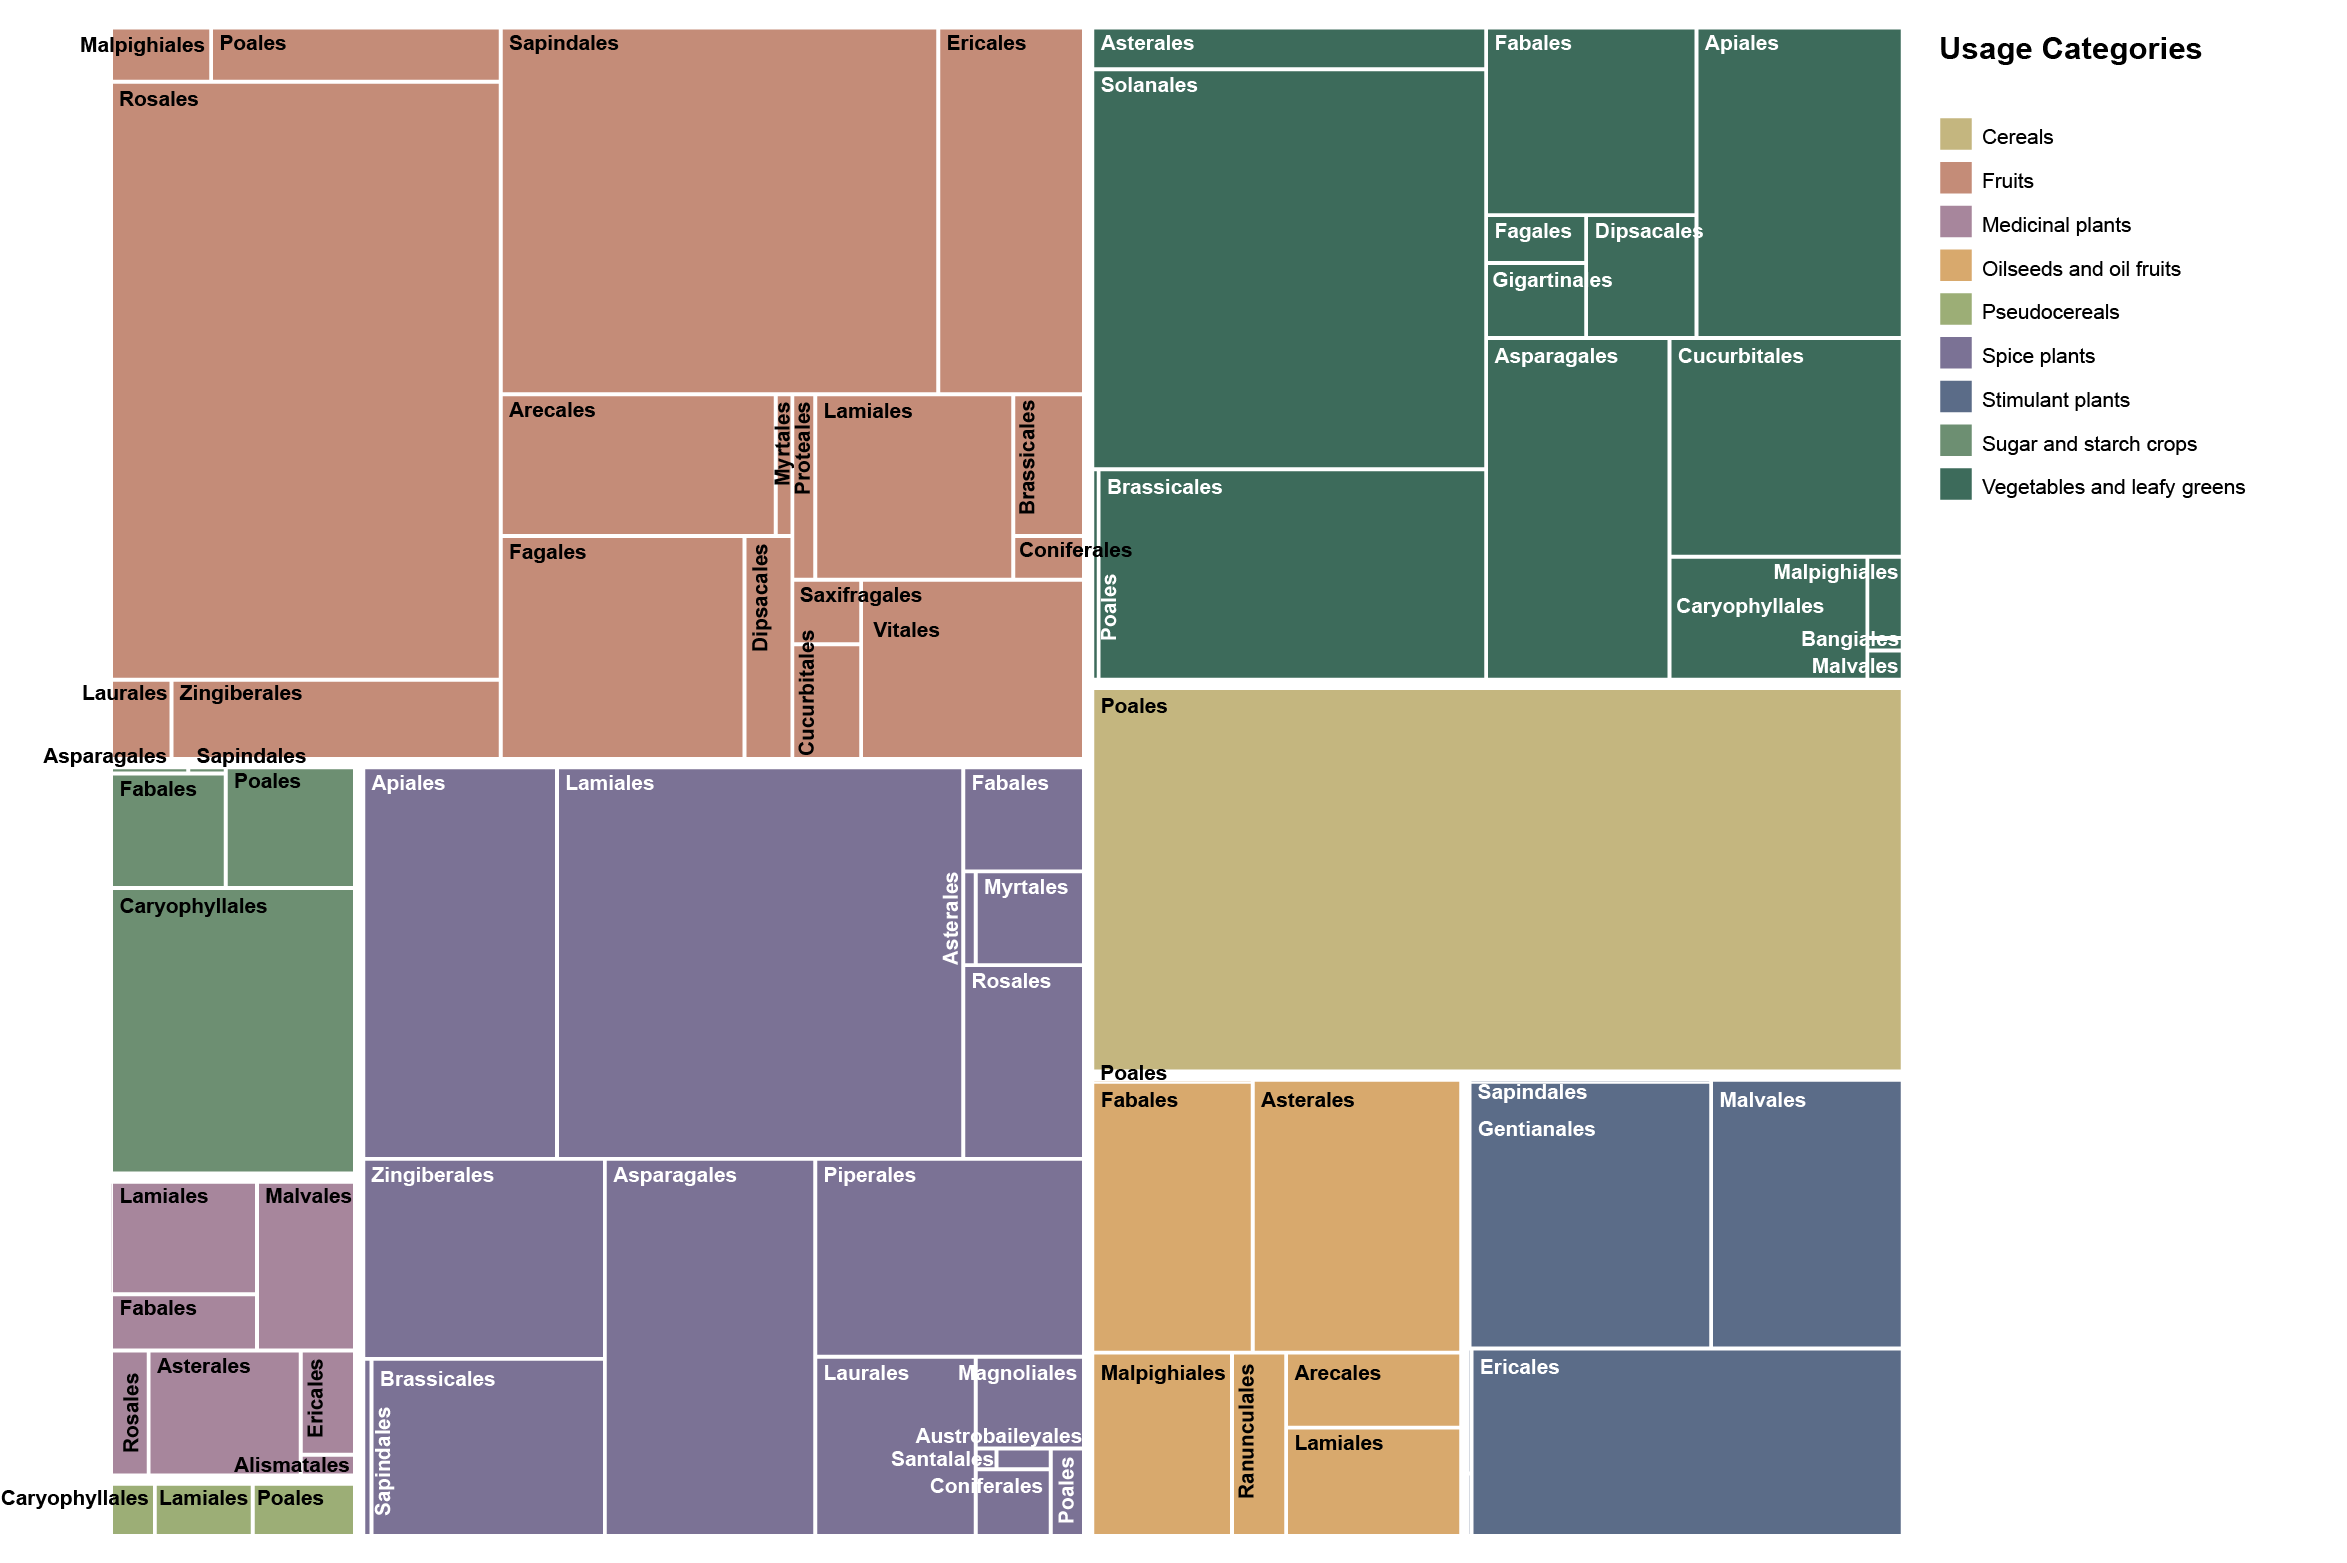
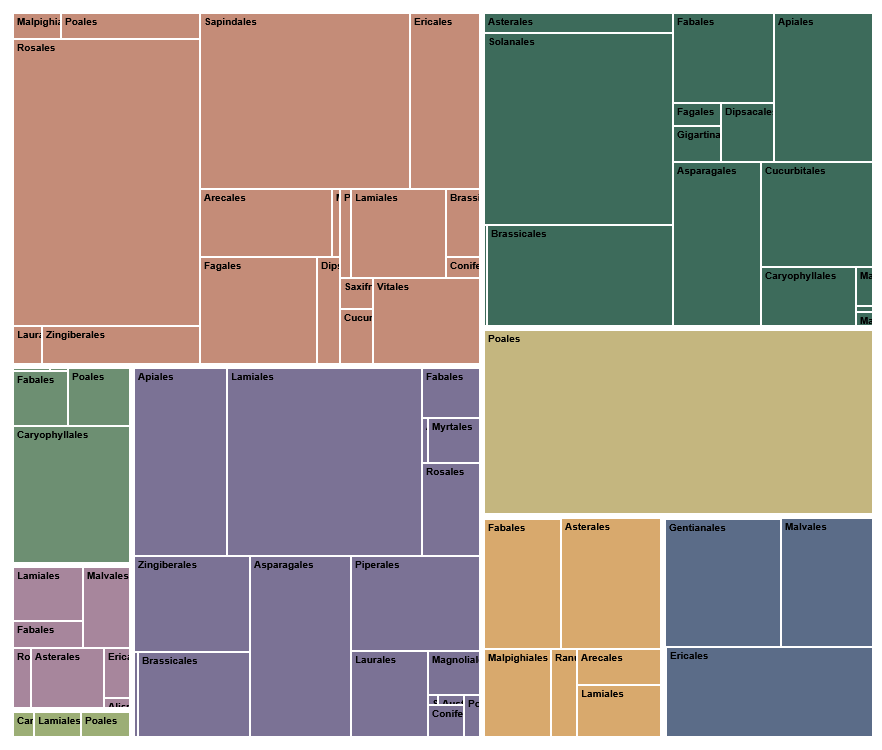
Figure 7: Treemap showing the contribution of plant orders to usage categories
Beyond individual plants and seasonal patterns, Nutritio Botanica also examines how plants appear together. For this purpose, all possible pairs of species were analysed using co-occurrence counts and the lift metric, which highlights associations that occur more often than expected if two plants were consumed independently.
Rather than displaying the full distribution of lift values — which is heavily skewed and dominated by weak associations — the visualization focuses exclusively on medium and high lift pairs. The chord diagram therefore does not represent frequency, but strength of association, making structural relationships visible that would otherwise be lost in aggregate statistics.
A clear cluster emerges among a group of medicinal plants: Marrubium, heath speedwell, lady’s mantle, common mallow, cowslip, ribwort plantain, pimpinella, marsh mallow, sage, and Achillea. These species are not simply frequent on their own; they are consumed together repeatedly, resulting in lift values far above what random co-occurrence would predict.
The associations within this cluster point to shared usage contexts rather than botanical proximity. These plants commonly appear in functional preparations such as herbal teas or lozenges, where multiple species are combined deliberately. Their strong mutual links reflect a narrow and recurring mode of consumption, in contrast to staple plants that appear across many unrelated meals.
Importantly, the absence of a strong link can be just as informative. Barley and hops, for example, are intuitively connected as the core ingredients of beer, yet their association remains weak. Barley appears across a wide range of contexts - cereals, porridges, muesli - while hops are largely confined to beer. As a result, their co-occurrence does not exceed much what would be expected by chance to a significant degree.
Notably, dense associative structures are rare. Out of more than 2,500 analysed plant pairs, only a handful reach medium or high lift values. This indicates that most plants enter the diet independently, even when overall botanical diversity is high.
The association analysis thus reveals an important distinction: diversity does not imply interdependence. While many species contribute to daily intake, strong botanical relationships emerge only where usage is specific, intentional, and repeatedly structured. The chord diagram makes these otherwise hidden patterns of co-consumption visible.
For each plant, the three strongest associations are reported on the respective plant page, provided the pair exceeds a support threshold of 0.05.
In this treemap, each rectangle represents the relative weight of an order within a usage group in my diet.
The figure makes one central point immediately clear: usage categories are not botanically uniform. They are cultural and functional groupings that slice across plant evolution in uneven ways - sometimes drawing broadly from many lineages, and sometimes collapsing almost entirely onto a single branch of the angiosperm tree.
Cereals form the starkest extreme. In this dataset, cereals show complete order-level exclusivity: every cereal record falls within Poales. This is a taxonomic monopoly within a usage category: the cultural idea of “cereal” maps onto a single evolutionary lineage.
At the opposite extreme, fruits occupy the most botanically pluralistic end of the spectrum, drawing on 18 orders. Fruits are a special case because English largely conflates what German distinguishes as Früchte (botanical) versus Obst (culinary). Botanically, true fruits are an angiosperm innovation (seed-bearing structures derived from flowers), so “fruit” in the strict sense already implies a shared evolutionary origin. The usage group shown here follows the culinary/utility notion (Obst, including culinary nuts): it combines fleshy fruits with items where the edible part is the seed (e.g., hazelnut, walnut, pistachio), and includes pine nuts as a gymnosperm exception that nonetheless fits the same culinary role
Several usage groups are multi-order while still being strongly top-heavy.
Spice plants (including herbs & spices) is among the most taxonomically broad categories (17 orders), but the distribution is sharply uneven. Lamiales is the single largest contributor, ahead of Asparagales, Apiales, and Piperales. Taken together, these four orders contribute about 66% of the spice records. The treemap thus suggests a dual story: aromatic and flavor traits recur widely across flowering plants, yet the spices I actually used cluster disproportionately in a few “spice-productive” lineages.
Vegetables and leafy greens sit closer to the middle: broad participation (15 orders) without a single order becoming exclusive. Still, the treemap shows clear anchors - Solanales, Brassicales, and Apiales together contribute about 58%. In other words, “vegetables” are evolutionarily eclectic, but day-to-day vegetable eating still relies on a handful of highly versatile orders.
Several usage groups reveal intriguing patterns of dominance that are strong yet non-exclusive. Stimulant plants, for example, are almost exclusively sourced from Ericales, Gentianales and Malvales - not-too-closely related orders that yield our beloved tea, coffee, and cocoa. The sugar and starch crops are primarily dominated by Caryophyllales, which account for an impressive 70% of records in this category, entirely driven by sugar beet. In the realm of oil seeds and oil fruits, Asterales leads with a 33% contribution, followed by Fabales and Malpighiales.
Pseudocereals illustrate especially well how “usage” can reorganize taxonomy. Although pseudocereals are often botanically associated with Caryophyllales, the treemap indicates that consumption was led by Poales (42%) and Lamiales (40%).
Reading across the entire treemap reveals two higher-level patterns:
Multi-role backbone (keystone) orders recur across multiple usage groups and quietly supply much of the diet’s structure. Poales is the clearest example: it completely defines cereals and also appears beyond that role elsewhere. Lamiales similarly spans categories (dominant in spice plants and prominent in pseudocereals), showing how a single order can support very different culinary functions.
Fourteen plant orders contribute exclusively to one usage category.
Across all plant orders, Poales show the broadest functional reach, contributing to seven different usage categories. They are followed by Fabales with contributions to six, and Lamiales to five usage categories. Notably, no single order spans the entire spectrum of use. Even the most versatile lineages occupy only part of the dietary system, underscoring that functional breadth is distributed across multiple evolutionary branches rather than concentrated in one.
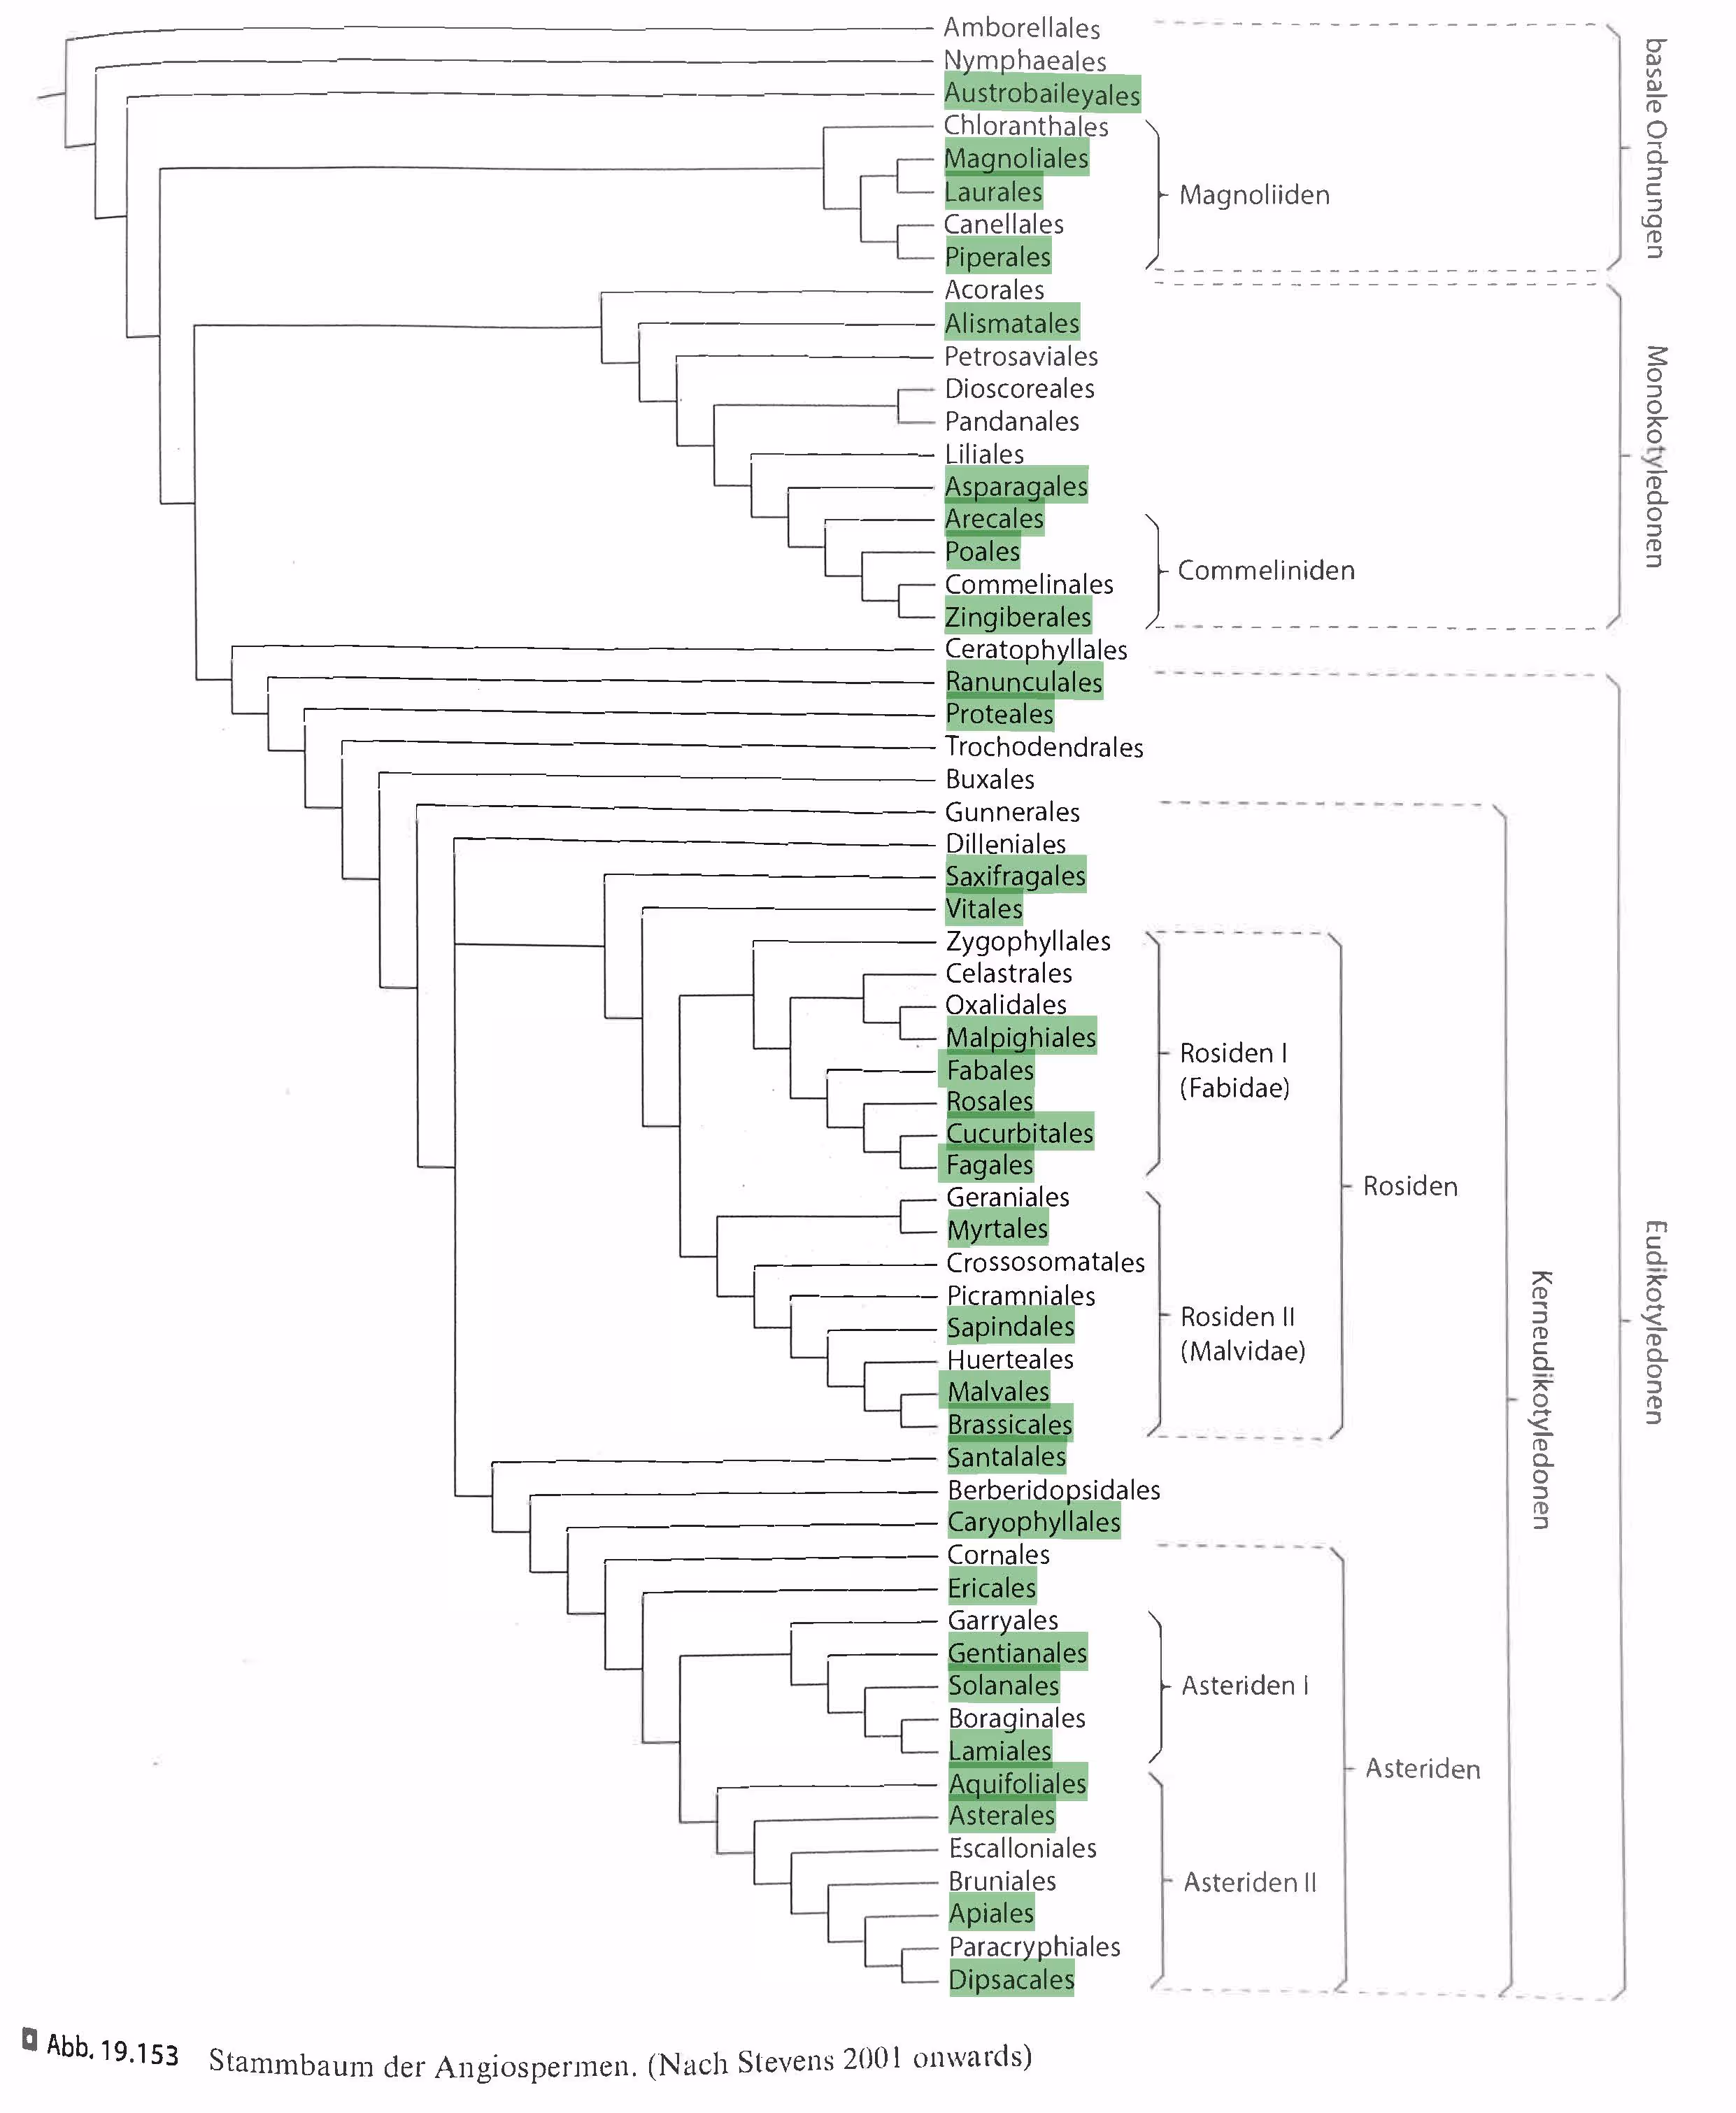
Figure 8: Taxonomic tree of angiosperms orders. Orders represented in the Nutritio Botanica dataset are highlighted in green.
(Strasburger − Lehrbuch der Pflanzenwissenschaften; after Stevens, P. F. (2001 onwards). Angiosperm Phylogeny Website. Version 14, July 2017 [and more or less continuously updated since])
A complementary perspective on the treemap is provided by its absences. Of the 62 currently recognised angiosperm orders, 32 are represented in the dietary log, while 29 are not. These missing orders do not form an obvious “empty branch” on the angiosperm tree; instead, they appear scattered across the phylogeny, suggesting that non-consumption is not explained by a single taxonomic or evolutionary boundary.
Why nearly half of all angiosperm orders are absent is not immediately evident from the results alone. Explaining these white spots would likely require a closer look at the intersection of plant physiology and cultivation history: which lineages tend to produce edible organs in forms compatible with human diets, which are constrained by toxicity or low palatability, and which simply never entered (or did not persist in) agriculture due to domestication potential, agronomic yield, storability, processing requirements, and cultural diffusion. In that sense, the blank areas are not just gaps in the dataset—they point to deeper filters that shape what becomes a food plant in the first place.
Taken together, the results portray a diet that is highly diverse in daily composition yet structured by concentration: roughly 30 plants appear on an average day, but a small set of staples repeatedly provides the backbone, while most species occur only occasionally. Diversity is also stable across time—seasonality is surprisingly weak for most frequently used plants—suggesting that modern availability and preservation smooth out what would historically have been stronger seasonal signatures. Co-occurrence patterns add a further layer: strong associations are rare and emerge mainly where use is deliberate and ritualized (notably among medicinal plants), reinforcing that diversity does not automatically imply tight interdependence. Finally, the taxonomic lens shows how culinary categories cut unevenly across evolution, from the order-level monopoly of cereals (Poales) to the pluralism of fruits (18 contributing orders), while the “white spots” highlight that nearly half of angiosperm orders remain absent for reasons that likely lie beyond taxonomy alone.
Against this backdrop, the headline figure—222 plants from 206 species—can be read in two opposite ways. Compared with the handful of animal species that typically recur in non-vegetarian diets, it is probably an order of magnitude larger. Compared with the botanical world, it is tiny: out of roughly 215’000 catalogued and almost 300’000 predicted land plant species*, it samples only a minute fraction.
Whatever perspective we take, it is clear that plants are not mere garnish on the plate but rather the foundation of our diet and existence. Reason enough to be aware and stay curious.
FINE
* Mora C,Tittensor DP,Adl S,Simpson AGB,Worm B (2011): How Many Species Are There on Earth and in the Ocean?. PLOS Biology 9(8):e1001127.
https://doi.org/10.1371/journal.pbio.1001127